As we find ourselves immersed in international break No. 17 of the young European soccer season (OK, it’s No. 3), it’s a pretty good time to step back and absorb the chaos that we’ve witnessed one-fifth of the way through. The funkiness resulting from a blink-and-you-miss-it offseason, along with a loaded schedule for Europe’s top teams, have resulted in all sorts of strange results and dropped points. Granted, Bayern and Paris Saint-Germain are again looking like the class of the Bundesliga and Ligue 1, respectively, but both La Liga and Serie A are more wide open than they’ve been in years.
From the perspective of pure oddity, however, everything else pales in comparison to what we’ve seen from the Premier League. Not only are a whopping nine teams within five points of the top of the Premier League table — last year, Liverpool had already established an eight-point lead on the field at this point — but Manchester City, Manchester United and Arsenal aren’t even among those nine!
– Stream ESPN FC Daily on ESPN+ (U.S. only)
– Predict results in ESPN’s English Soccer Pick ‘Em!
– ESPN+ viewer’s guide: Bundesliga, Serie A, MLS, FA Cup and more
Back in September, I previewed the European season with certain sets of statistical factors:
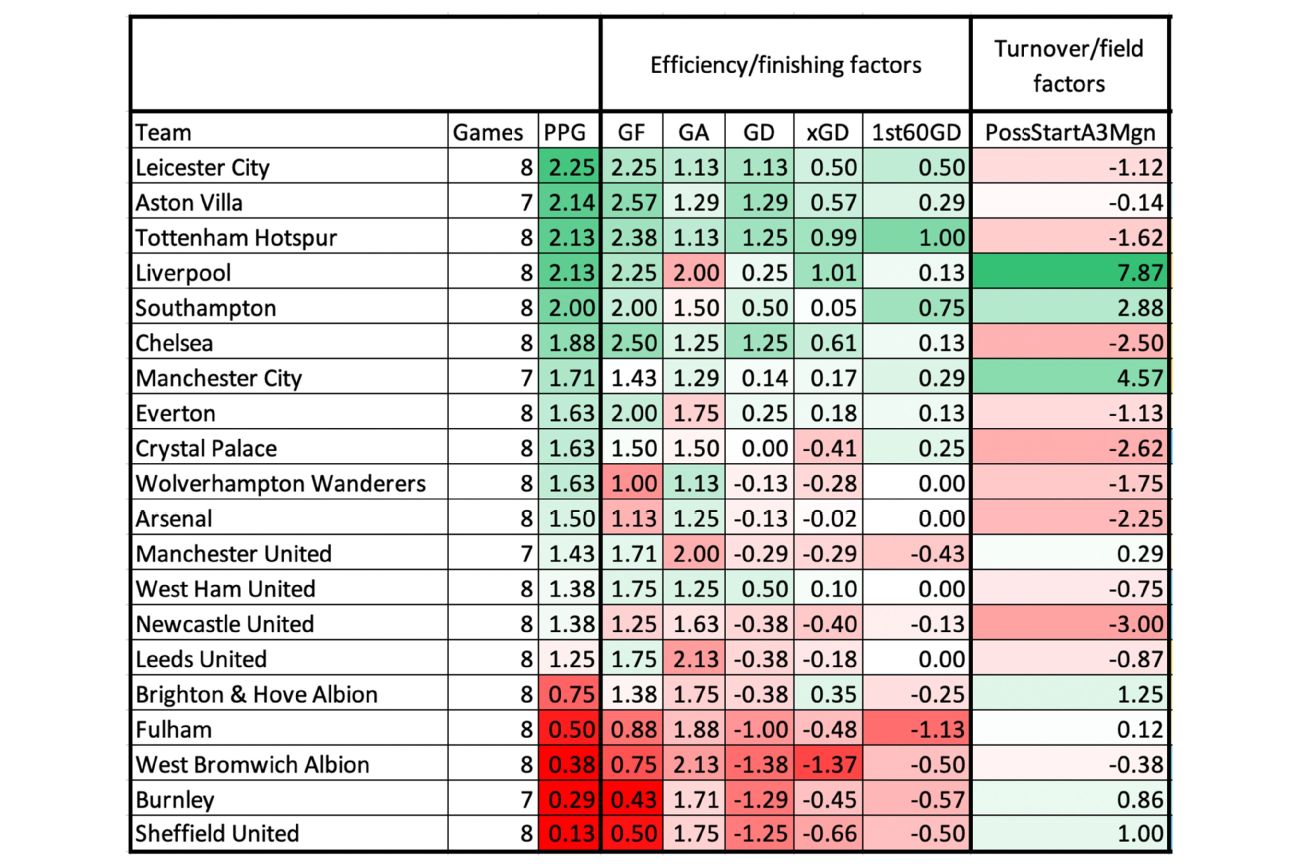
– Efficiency and finishing factors: Goal differentials, expected goal differentials, scoring in the first 60 minutes of games and the second half of the season, etc.
– Turnover and field factors: Primarily, who’s starting more possessions in the attacking third
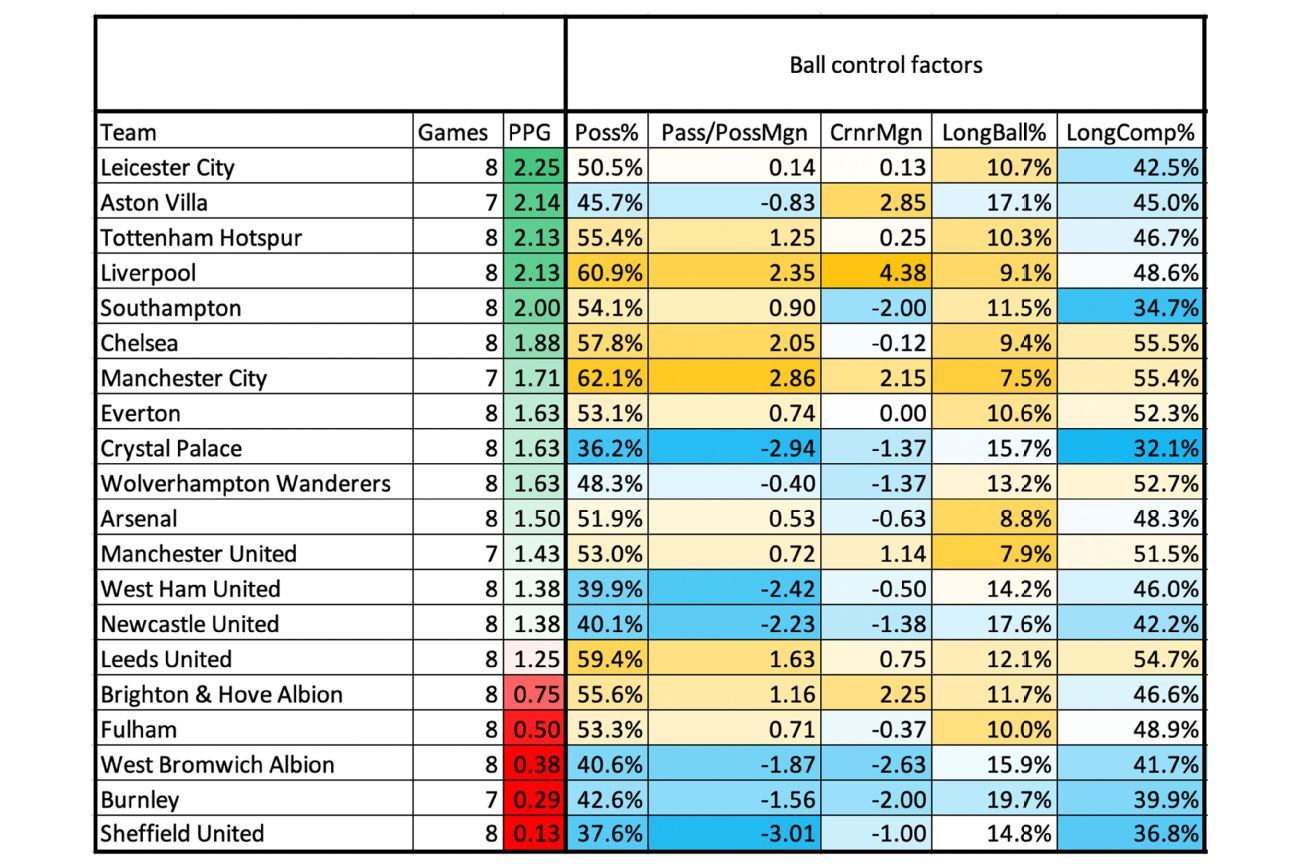
– Possession factors: Possession rate, passes per possession, long ball attempts and completions, etc.
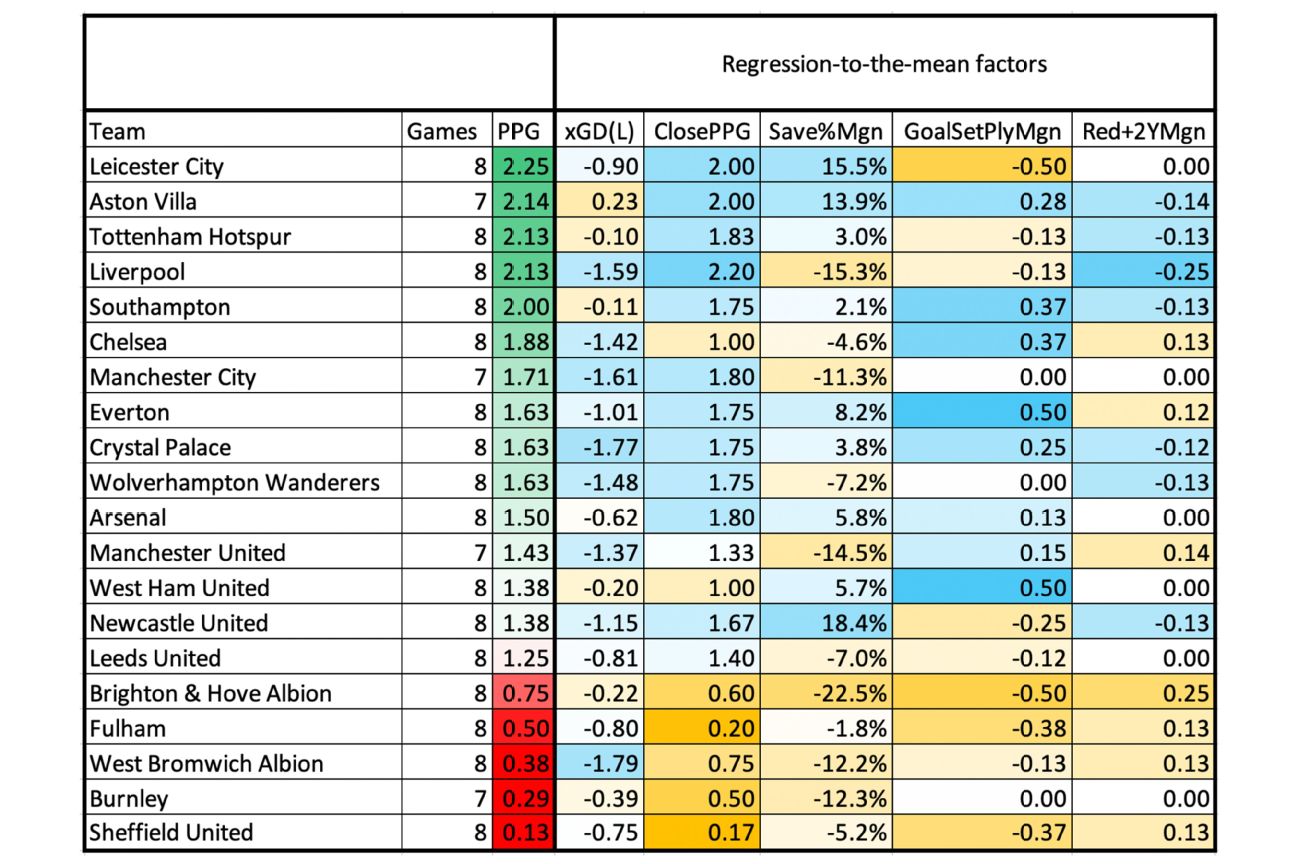
– Regression-to-the-mean factors: Points per game in close matches, save percentages, set-piece goals, red cards, things that, if extreme, tend to revert over time (and bring your results with them)
The goal was to look at the things that have the most direct impact on both year-to-year and month-to-month success. Early in a given season, these stats can tell us quite a bit about what of the early chaos is sustainable and what will likely revert to form soon.
All five leagues deserve a deep dive; they all have interesting stories to tell, from the stagnation of certain superclubs (Barcelona, Juventus, the Manchesters and, to a degree, PSG and Real Madrid), to La Liga’s identity crisis (Atletico Madrid: scoring and possession leaders), to RB Leipzig‘s across-the-board solidity post-Timo Werner, to the incredible and not altogether unexpected title race that is taking shape in Serie A.
For today, though, we’ll put nearly all of our focus on the wackiest league to date: the Premier League.
What a delightful mess the Premier League has been so far

– 1st60GD = goal differential in the first 60 minutes of matches. Game state can make things odd late, but controlling the more neutral portions of the game is conducive to more long-term success
– PossStartA3 = possessions starting in the attacking third; the more frequently you begin possessions deep in opposing territory, the more likely you are to create high-quality scoring chances
Of the five clubs averaging two or more points per game, only two are among the league’s six richest clubs. Aston Villa have gone from barely surviving relegation in 2019-20 to leading the way in scoring and goal differential. Liverpool, Manchester United and Manchester City have all suffered jarring blowout losses.
Southampton is ahead of both Liverpool and City in goal differential, and while the xG numbers make a little more sense — Liverpool, Tottenham Hotspur and Chelsea are the top three clubs in that regard — Villa and Leicester are still fourth and fifth in xGD. City is eighth, behind Brighton. Up is down, left is right, etc.
(The best of last week’s election-themed meme tweets, by the way. Topical, funny… and containing more than a kernel of honesty, as we know that, like other counts, this one won’t stop either, and we know some of these oddities will right themselves over time.)
In fact, some of them already have. Everton have lost three straight after a torrid start while Leeds, who scored a run of early points despite serious xG disadvantages, have lost three of their last four matches — two of them by 4-1 margins.
Despite early dysfunction, Manchester City is still the No. 2 betting favorite behind Liverpool, and there’s reason for that. Still, the longer this set of unexpected runs of form go — the longer Villa and Southampton crank out points, the longer that United, Arsenal and City leak points, the more the injury bug takes bites out of Liverpool, etc. — the more it’s going to alter the final table.
1:27
Steve Nicol reacts to the news that Liverpool’s centre-back Joe Gomez is set for a lengthy spell on the sidelines.
Possession doesn’t mean as much as it used to (for now)

– Pass/Poss = passes per possession
– Long ball = a pass more than 35 yards that is aimed at a teammate (i.e. not just hurled downfield)
Possession numbers have correlated quite well with success in recent years, both because of the effects it has on field position and scoring chances and because, well, the richer (read: more likely to succeed) clubs mostly play the possession game.
Early in 2020-21, however, possession hasn’t correlated all that well. Among the top five teams in possession rate, only one is in the top five in points per game; meanwhile, three of the top eight possession teams are in the bottom six in points per game. It seems there are points to be gained by remaining organized defensively, conserving energy here and there, and striking vertically when the opportunity presents itself.
In a recent New York Times newsletter, writer Rory Smith paraphrased Bayern Munich manager Hansi Flick: “The bulk of Europe’s superpowers favor a style that has to work perfectly, according to Flick’s estimation, to work at all… In these highly specific circumstances, this slog of a season, they may be more vulnerable than normal.” We’ll see how long it remains that way, but it’s definitely been the case thus far: while the correlation between possession rates and points per game was a solid 0.74 from 2010-11 through 2019-20 (the closer to 1, the stronger the correlation), it’s only 0.54 in the early stages of 2020-21.
Aside from Villa, the most interesting team in the league to me at the moment is the one led by the possession master: Pep Guardiola and his Manchester City.
The Sky Blues fit an odd profile last year, dominating from an xG perspective (more than Liverpool, even) but randomly getting sliced up by counterattacks and high-quality scoring chances, dropping a lot more points than the underlying numbers suggested they should have. The blueprint for beating City — not to mention plenty of other teams with the possession-and-pressing style — had been pretty clear for a while, but it appeared both that more teams were capable of executing it and City was occasionally less capable of stopping it.
This season, on the other hand, they’ve just been mediocre. They’re currently on pace for just 65 points — usually good for about fifth place average — and unlike the last go-round, this isn’t simply a case of luck. They are eighth in expected goal differential, after all. Injuries have slowed City’s attack and while they’re still attempting fewer long balls than anyone else in the league, they’re also completing only 55% of the passes they attempt, down from 65% last year. (Letting veteran David Silva leave for Real Sociedad probably hasn’t helped with this.)
Like many teams during this congested schedule, Guardiola appears to be easing off the pressure a bit — City is allowing 11.8 passes per defensive action (eighth in the league) as opposed to last season’s 10.1 (third) — and as a result, opponents are controlling the ball a bit more than before. But this isn’t doing anything for the quality of shots City are allowing and it fits the same profile as last year: City are fourth in the league in shots allowed per possession and first in the percentage of opponents’ possessions finishing in the attacking third … but they’re also second-worst in xG allowed per shot. The drop-off in aggression has contributed to offensive stagnation but hasn’t helped the defense as much as Guardiola probably hoped.
Will he fix these issues? The odds are pretty good; he’s still got both a track record and a big payroll. But in an environment where possession might not mean as much as it used to, Guardiola’s fixes will have to be particularly good.
Regression always looms

– xGD(L) = a team’s xG differential in losses. The higher it is, the more unlucky you’ve likely been while dropping points. The lower it is, the more dominant your opponent has been
– ClosePPG = points per game in matches decided by 0-1 goals. Higher-quality teams fare better than lower-quality teams here, but if you’re TOO successful or unsuccessful, regression-to-the-mean will likely follow
– Save% and GoalSetPly = save percentage and set-piece goals, respectively. Some teams have better keepers and perform better on set pieces, but as with ClosePPG, if the margins are too high or low, regression is probably on its way
– Red+2Y = red cards and second yellows. They can drastically impact a given match, and they’re pretty random overall. If you have benefited from them, you probably won’t continue to
Liverpool was the league’s best team last season, but the Reds’ average of 2.5 points per game in close matches was almost guaranteed to regress. It has, but only so much. They beat Leeds, Sheffield United and West Ham each by one goal and drew with Everton and Manchester City. Their only loss was by five to Villa. This average will probably slip a bit more, but it’s at least in a more rational and sustainable range.
Other regression-to-the-mean line items since last season: Chelsea’s save percentage margin has improved significantly, and last year’s three best teams from a set-pieces perspective (Liverpool, City, Burnley) have all completely regressed.
Liverpool has been also beset by another regression issue that we’ll probably need to figure out how to add to the table at some point: injuries.
0:55
Steve Nicol weighs in on Chelsea’s attacking options, including how he would use Kai Havertz and Tammy Abraham.
Few teams had a more stable lineup than the Reds last year. Seven players logged at least 80% of Liverpool’s available minutes in league play in 2019-20; across Europe’s Big Five leagues, only Wolves (nine) and Athletic Bilbao (eight) could top that. But among those seven players were all-world centre-back Virgil van Dijk (out for months with knee ligament damage), full-back Trent Alexander-Arnold (out for a few weeks with a calf issue) and winger Sadio Mane (missed time due to a coronavirus diagnosis).
Key van Dijk fill-in Fabinho (67% of available minutes this year) could miss time because of a hamstring complaint, and Liverpool’s other starting centre-back, Joe Gomez (82% of available minutes this year), injured his knee this week in national team training and is set to miss the rest of the 2020-21 season. (Tell me again why we have international breaks at all right now?)
The combination of wear and tear from this odd year, coronavirus diagnoses and old-fashioned injury woes have conspired against the defending champs in ways that they very much did not last season. (Wolves and Athletic, the two teams more stable than Liverpool last year, have each suffered from freshly unstable lineups, too.)
Progression and regression candidates
The shading above signifies who might be doing a little bit too well or too poorly in a given category. Blue means regression potential, orange signifies progression.
— Teams with blue shading in at least four categories (i.e. most likely regression candidates): Aston Villa, Everton, Crystal Palace, Newcastle United
–Teams with orange shading in at least four categories (teams most likely to improve): Brighton, West Brom. Chelsea, Fulham, Burnley and Sheffield United each have three orange categories
What it all means going forward
In case you needed a reminder that the season is still extremely young, check out FiveThirtyEight’s club soccer projections. The 538 elo ratings are conservative and slow-moving by nature — most good projection systems tend to be that way — and the current league favorites are exactly the same as before the season began. Manchester City leads the way with a 46% chance, while Liverpool is second at 28%.
Despite all the iffy early play, City’s odds have fallen only 11 percentage points from 57% in the preseason, and their impressive Champions League form has helped to back up the thought that while they’re not running at full-steam at the moment, they’re also not totally broken.
It’s not hard to see this race remaining pretty wide open in the coming months, however. Maybe not “nine teams within five points” open, but open. City indeed isn’t cranking in fifth gear yet, and Liverpool’s lineup is in dramatic flux. Who are perhaps the most likely candidates to take advantage if neither of these two teams can mount a charge at 85+ points?
Chelsea. The regression-to-the-mean categories above indeed smile on them a bit, and after a shaky start their form improved in the weeks prior to international break No. 193, as more of their key players approached full fitness.
Chelsea’s past four matches since a 0-0 draw at Manchester United: a 4-0 win at Krasnodar, 3-0 home wins over Burnley and Rennes, and a 4-1 win over Sheffield United. They’re only three points off of the top of the table. New additions Timo Werner (five goals, one assist) and Hakim Ziyech (two goals, three assists, nine chances created) and Ben Chilwell (one goal, three chances) shined in this stretch, too, and they get Newcastle United and reeling Leeds and Everton among their next four league matches. We could be talking about them as leaders soon.
1:39
The ESPN FC pundits gauge Jose Mourinho’s success so far at Tottenham.
Leicester City. We should probably acknowledge the leaders, yeah? Leicester were one of the stories of the early season last year, holding onto second place into January before fading and barely missing the Champions League. Well, this year the Foxes are four points ahead of last year’s pace through eight matches, and they’ve reinvented themselves a bit in the absence of vital defensive midfielder Wilfred Ndidi.
Manager Brendan Rodgers has eased significantly off when it comes to defensive pressure and is slowing the tempo down, but Leicester are still winning at a high level. They are finishing fewer possessions in the attacking third than their opponents, which will likely cause regression at some point, but when Ndidi returns Rodgers might open things up more, too.
Tottenham Hotspur. Spurs might have the most complete statistical profile at the moment. They are third in goals scored per match, second in goals allowed, tied for second in goal differential, second in xG differential and first in first-60-minutes goal differential. Regression factors don’t hoist up any massive red flags, either.
Spurs have been glitchy at times, needing late goals to get by Burnley and West Brom along with a shocking loss to Royal Antwerp in the Europa League, but they have been as stable as anyone, and we haven’t yet seen the full effects of late-transfer-window acquisitions like Gareth Bale or Carlos Vinicius. In the preseason I considered them, at worst, a serious contender for a Champions League bid, and at the moment they might have a legit case for a run at a bigger prize.